
Everything You Need to Trade Smarter
From AI-driven analysis to real-time signals, discover the tools designed to sharpen your trading edge.

Smart Candle Pattern Analysis
AI detects meaningful patterns in past candlesticks to guide future trades.

Backtesting Made Easy
Validate strategies with historical data to improve confidence and accuracy.

AI-Powered News Impact Analysis
See how major news events influence price action over time.

Personal Trading Mentor
Get personalized market insights and trading education from your AI assistant.

Chart Signals & Notifications
Stay informed with signals tailored to your strategies and market interests.

Intuitive & Trader
Friendly Interface-Designed for both beginners and pros to navigate markets with ease.

Candle Tracker
Track the path of price through historic candle formation.

Built for Every Trader
Whether you're a beginner or a pro, every trader needs reliable market data and iC Candle provides it with tools for all experience levels
Features
Candle Scanner
- Scan markets, find patterns, and analyze probabilities.
Candle Signal
News Impact Analyze
Mr.Candle
More Than Just Patterns
Stay Ready for Every Opportunity Automatically detect price action patterns, save your favorite market setups, and get real-time notifications when new opportunities appear
Double Bottom Pattern
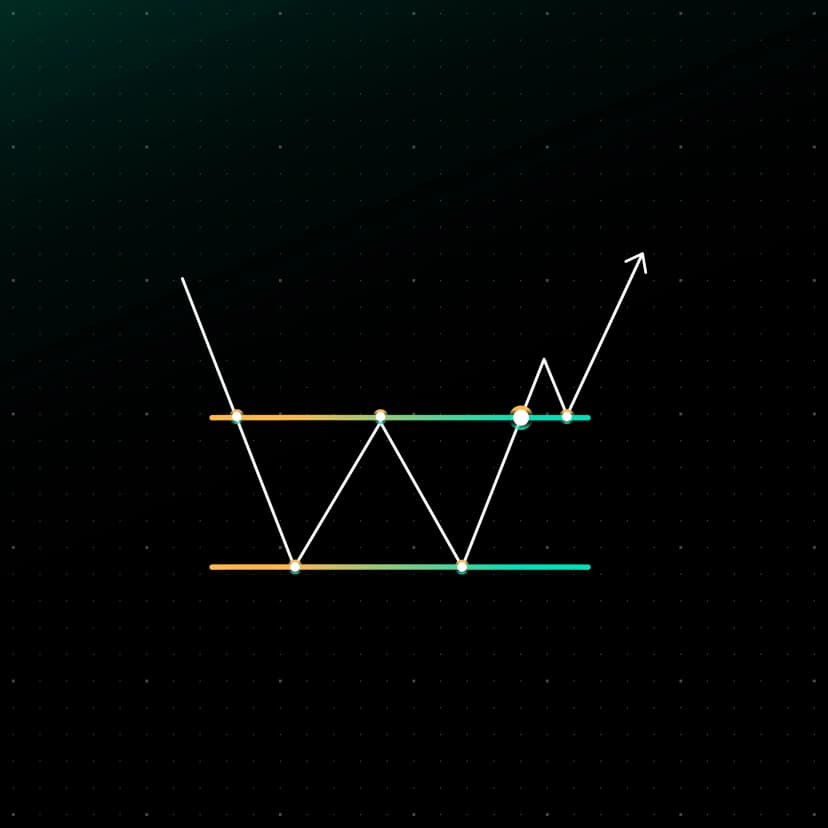
These patterns form when price tests the same level twice and fails to break through.
- It shows that the market is losing momentum in one direction.
- A breakout outside the range usually signals a reversal is coming.
Double Top Pattern
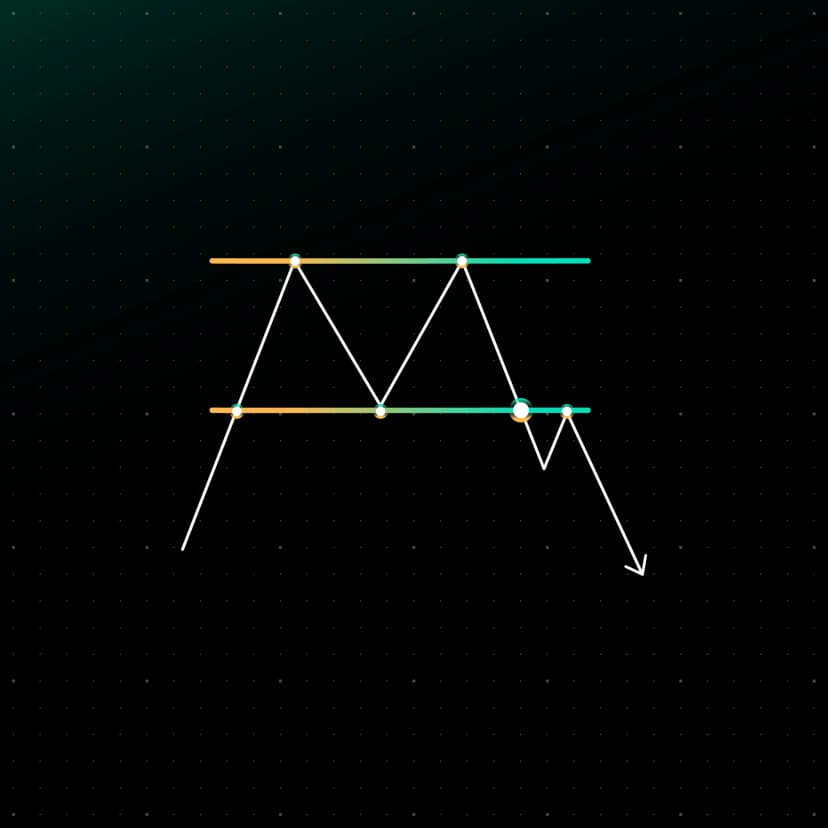
These patterns form when price tests the same level twice and fails to break through.
- It shows that the market is losing momentum in one direction.
- A breakout outside the range usually signals a reversal is coming.
Bullish Flag Pattern
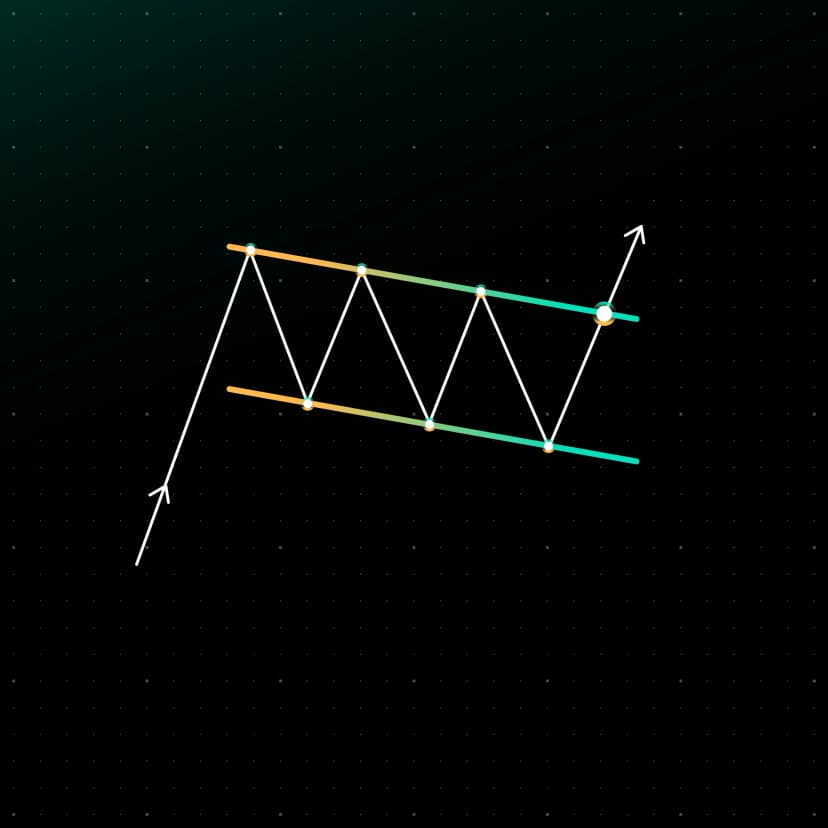
A brief pause or consolidation after a strong move (either up or down).
- Price moves in a small, sloped channel against the trend.
- Once it breaks out of the flag, the trend often continues in the same direction.
Bearish Flag Pattern
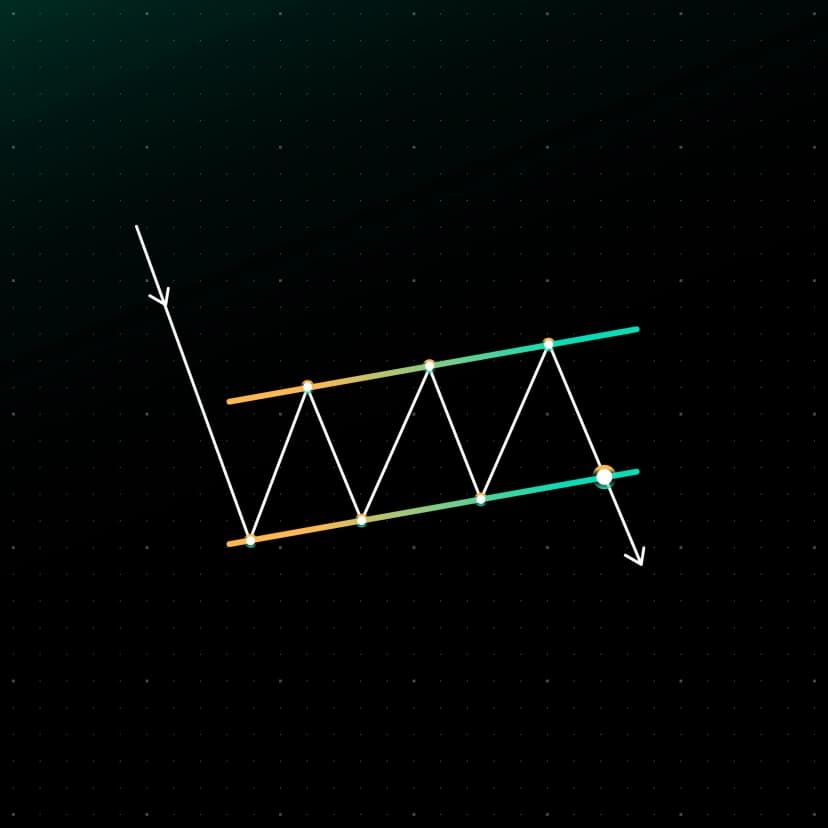
A brief pause or consolidation after a strong move (either up or down).
- Price moves in a small, sloped channel against the trend.
- Once it breaks out of the flag, the trend often continues in the same direction.
Bullish AAD Pattern
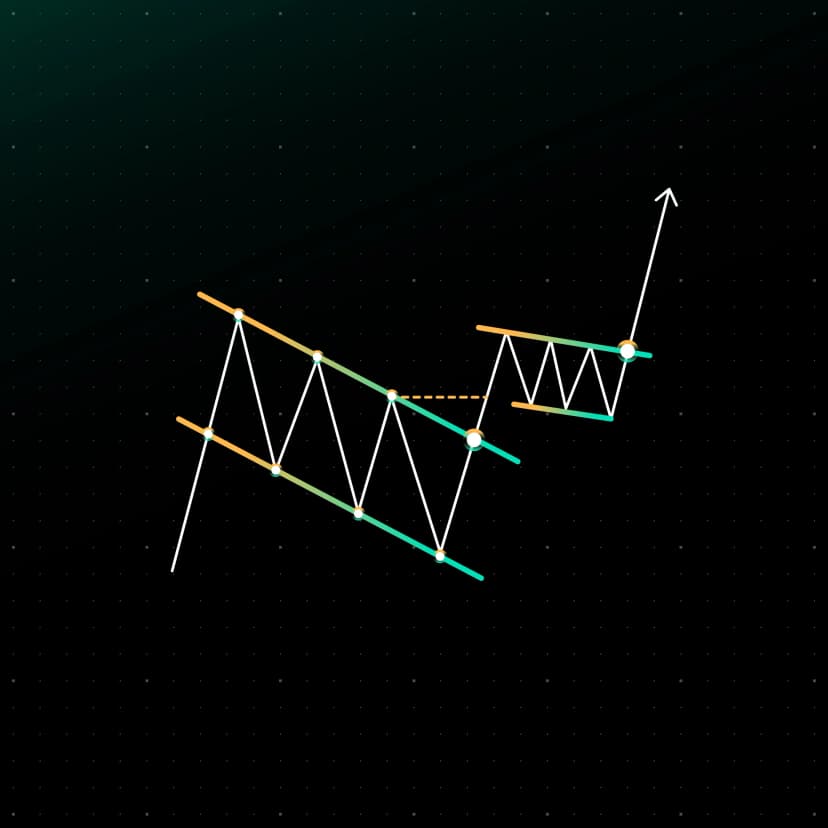
A custom pattern based on market structure and momentum shift.
- It spots areas where the trend is likely to change or continue, using swing highs/lows and breakouts.
- Often used with pitchforks and structure lines to time entries more precisely.
Bearish AAD Pattern
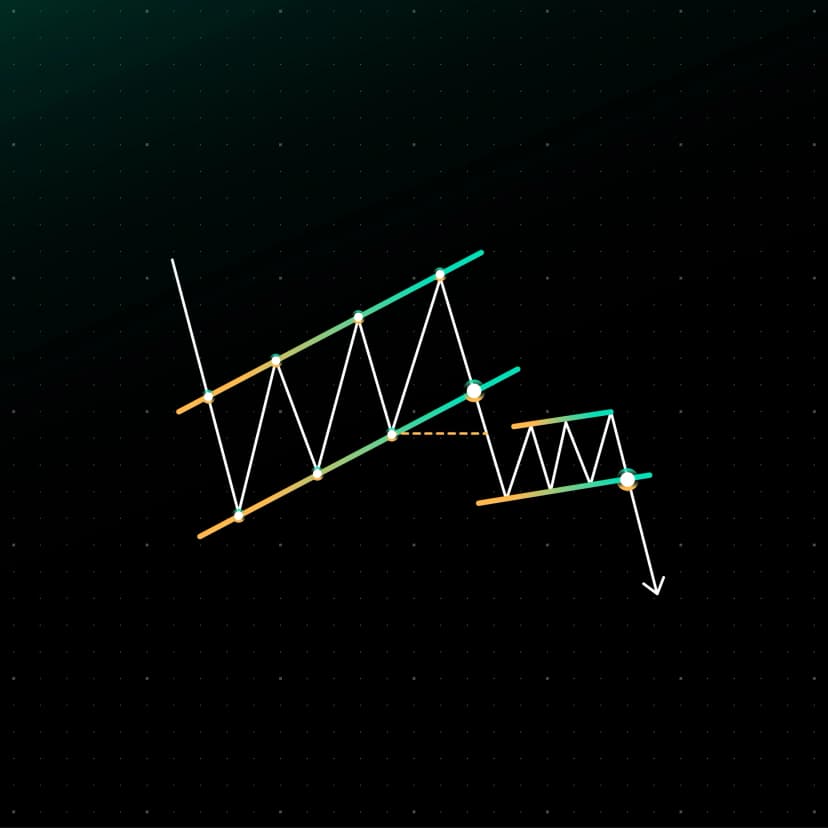
A custom pattern based on market structure and momentum shift.
- It spots areas where the trend is likely to change or continue, using swing highs/lows and breakouts.
- Often used with pitchforks and structure lines to time entries more precisely.
Rectangle Pattern
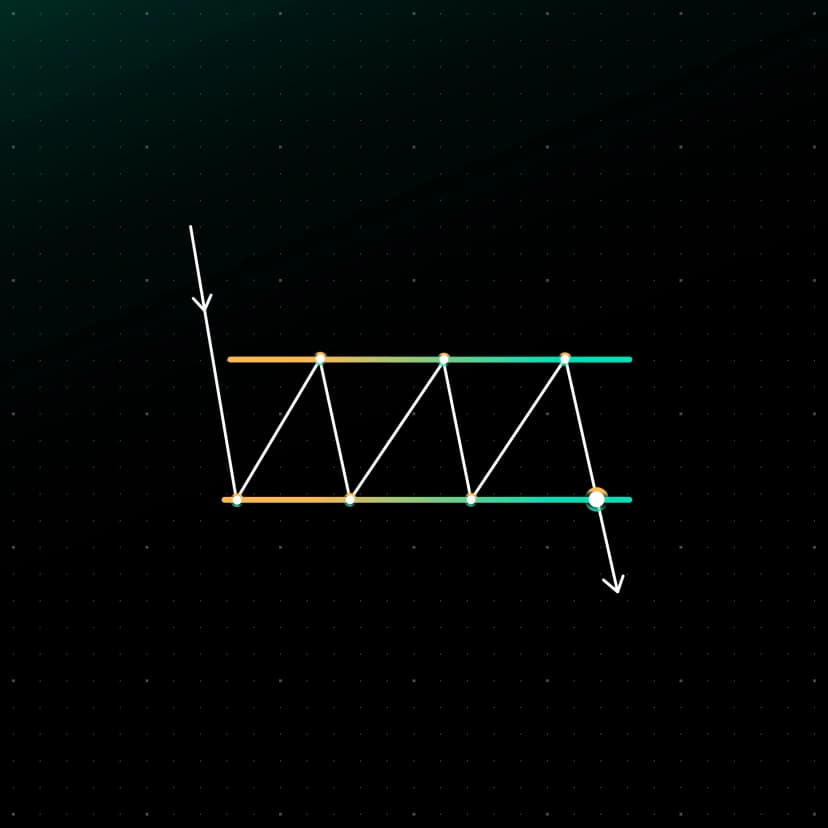
A sideways range where price bounces between support and resistance.
- It shows market indecision or consolidation.
- A breakout (up or down) usually leads to the next strong move.
Bullish Head and Shoulder Pattern
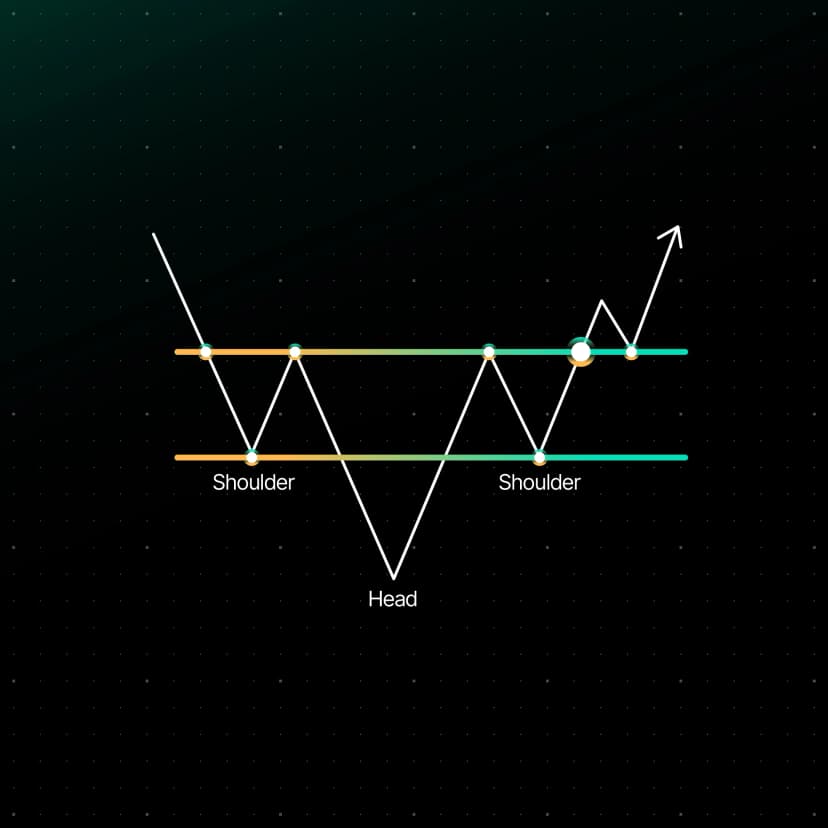
This pattern shows a shift in market strength and signals a possible trend reversal.
- It has three parts: one larger move (the "head") and two smaller ones (the "shoulders").
- When the pattern completes, price often breaks away and moves in the opposite direction of the trend before it.
Bearish Head and Shoulder Pattern
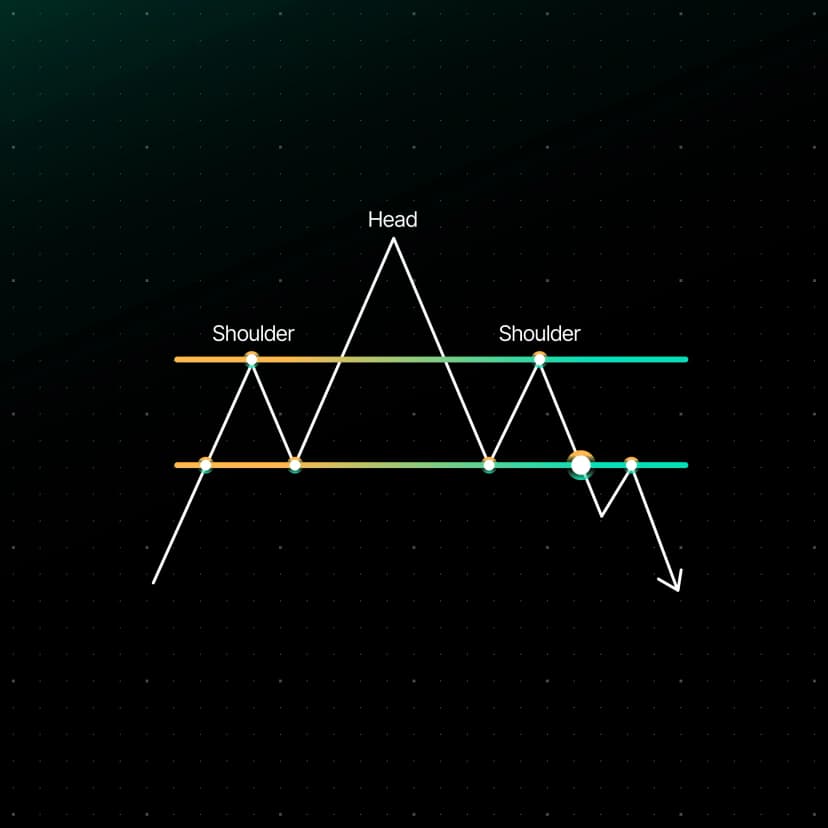
This pattern shows a shift in market strength and signals a possible trend reversal.
- It has three parts: one larger move (the "head") and two smaller ones (the "shoulders").
- When the pattern completes, price often breaks away and moves in the opposite direction of the trend before it.
Frequently Asked Questions